
You finished a data course. You can filter a spreadsheet, write a query with GROUP BY and build a bar chart. Then a job post asks for “a link to your portfolio,” and all you have is a certificate and a folder of course exercises that look like everyone else’s.
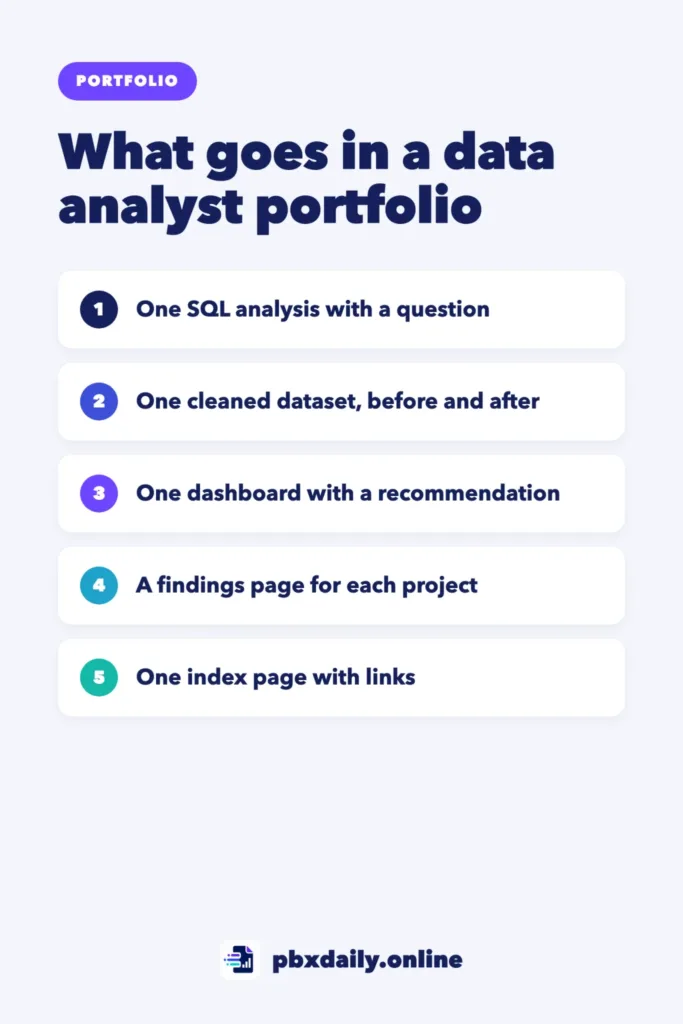
A data analyst portfolio doesn’t need 20 projects. Three are enough to start, as long as each one proves a different part of the job: getting answers with SQL, cleaning messy data and explaining results with a dashboard. This guide shows how to pick a theme and public data, the steps for each project, a findings template to copy and where to publish it all so a recruiter can review it in minutes.
What Hiring Managers Look For in a Data Analyst Portfolio
A reviewer opens your data analyst portfolio with a few questions in mind:
- Can you start from a question? Good analysis begins with a business question, not with a chart.
- Can you handle real, messy data? Course datasets are often clean. Real ones rarely are.
- Can you use the core tools? SQL, spreadsheets and one dashboard tool are the basics of the job.
- Can you explain what the numbers mean? A result without a recommendation is only half the work.
Step 1: Pick One Theme and Public Data
Choose one theme for all three projects, ideally from the field you already know: school data for a former teacher, prices or sales for a retail worker, public health for a nurse. One theme gives your portfolio a story and lets you talk about the data like someone who has seen the work up close.
Use public data from official open data portals:
- Data.gov: “The Home of the U.S. Government’s Open Data.”
- World Bank Open Data: “Free and open access to global development data.”
- data.europa.eu: “The official portal for European data.”
- Your country or city: many governments run an official open data portal.
Before you download anything, read the license on the dataset page and follow it, including how to credit the source. And never use data from your current or old job, such as customer, patient or student records, even if you remove the names. For more starting points, our list of portfolio project ideas for beginners has a section on data projects.



Step 2: Project 1, a SQL Analysis That Answers One Question
The first project proves you can get answers out of a database. Write one business question in plain English, such as “Which five regions spent the least per student last year, and how has that changed since 2020?”
- Load the dataset into a practice database such as SQLite or PostgreSQL.
- Write four to six queries that build toward the answer: filter, group, total and join if needed.
- Save the queries in a
.sqlfile, with a comment above each one saying what it answers. - Write the answer in two or three sentences, with the key numbers.
Keep each query easy to read, with one clause per line. For a refresher, our guide to SQL queries for beginners covers the eight queries you’ll use most.
Step 3: Project 2, a Data Cleaning Project With a Before and After
Cleaning takes a big part of an analyst’s time, and it’s easy to leave out of a portfolio. Pick a messy public dataset on your theme and show three things:
- Before: a raw sample where the problems show: duplicates, missing values, mixed date formats or one name spelled three ways.
- A cleaning log: a simple list of every change and the reason for it.
- After: the clean table and a short count, such as “4,812 rows in, 4,775 rows out.”
CLEANING LOG: [dataset name], [source], downloaded [date]

1. Removed 37 exact duplicate rows
   Why: same school ID and values, repeated in the export
2. Merged "Lincoln High", "Lincoln HS" and "LINCOLN HIGH SCHOOL"
   Why: same school, three spellings
3. Left 112 missing budget values blank
   Why: filling them would invent data (noted in Limits)
You can clean the data in a spreadsheet, in SQL or in Python. The tool matters less than the log, because the log shows your judgment.
Step 4: Project 3, a Dashboard With a Written Recommendation
The third project proves you can communicate. Build one dashboard page with three or four charts that answer one question, plus a short text box with what to notice and what you recommend.
Three tools let you start without paying:
- Tableau Public: Tableau calls it “a free cloud service.” Everything you publish there is public: workbooks and data “are not private and are freely accessible to anyone.” Publish only public data. The free Tableau Desktop Public Edition can also save workbooks on your computer.
- Data Studio: Google’s documentation says “Looker Studio is now called Data Studio,” so you’ll see both names in tutorials. Google describes it as “a no-cost tool” for reports that are easy to read and share.
- Power BI Desktop: Microsoft says you can create reports “for free,” but it points to the paid Power BI Pro for sharing them online. In a portfolio, show screenshots and the report file instead.
Pick the tool that appears most in the job posts you want. The recommendation can be one sentence: “Region C has the lowest spending per student and the biggest drop since 2020, so review its budget first.”
Step 5: Write a Findings Page for Each Project
Each project needs a short page that a recruiter can read in about two minutes. Put it at the top of the project’s README and use the same structure every time:
[Project title: the question in plain words]

QUESTION
[One business question, in one sentence]

DATA
[Source and link, date downloaded, license, rows and columns]

METHOD
[Tools used and the 3 to 5 main steps]

RESULTS
- [Finding 1, with a number]
- [Finding 2, with a number]
[One chart with a one-line caption]

RECOMMENDATION
[What someone should do, and why]

LIMITS
[What the data can't tell you: missing values, time period, gaps]

Links: [queries] [cleaning log] [dashboard]
Don’t skip the Limits section. It shows honesty and good judgment. For the longer story behind a project, see our guide to the developer portfolio case study, which covers data projects too.
Step 6: Publish It in One Place
Recruiters shouldn’t have to search. Give them one link that leads to everything:
- One GitHub repository with a folder per project: the findings page as the README, the queries, the cleaning log and the data files if the license allows. Our guide to a GitHub README recruiters will actually read shows the format.
- Your public dashboard link on the Project 3 findings page, plus a screenshot.
- One index page listing the three projects, with one line and one link each. It can be the main README or a simple site, as in our beginner developer portfolio guide.
data-portfolio-[theme]/
  README.md              index: 3 projects, 1 line each
  01-sql-analysis/
    README.md            findings page
    queries.sql
  02-data-cleaning/
    README.md
    raw-sample.csv
    clean.csv
    cleaning-log.md
  03-dashboard/
    README.md            with the public dashboard link
    screenshot.png
How to Show It on Your Résumé and LinkedIn
- On your résumé: add a “Projects” section with one line per project, naming the tool and the result. For example: “SQL analysis of public school budget data (SQLite): found the five regions with the biggest drop in spending per student.” Our career change résumé for tech guide shows where it fits.
- On LinkedIn: add the index page and the dashboard to Featured, and post one finding with its chart.
Mistakes That Weaken a Data Analyst Portfolio
- Charts without a question. They look like practice, not analysis.
- No cleaning shown. Perfect files hide how you handle real data.
- Private data from work. Even without names, it may break privacy rules.
- Broken or private links. Open every link in a private browser window before you apply.
Sources
- Tableau Help, Save Workbooks to Tableau Public
- Google Cloud, Data Studio documentation
- Microsoft, Power BI Desktop
- Data.gov
- World Bank Open Data
- data.europa.eu
Data Analyst Portfolio: Frequently Asked Questions
Do I need Python in my portfolio?
Not to start. SQL, spreadsheets and one dashboard tool cover the core of junior analyst work. If you know some Python, use it in the cleaning project. If not, add it after your three projects are online.
How many projects is enough?
Three complete projects are enough to start applying: one SQL analysis, one cleaning project and one dashboard, each with a findings page. Add more only when they show a new skill.
Can I use datasets from online courses?
They’re fine for practice, but reviewers have often seen those projects. For your three main projects, use official public data on your theme. If you do use a course dataset, ask a question the course didn’t ask, and check that its license lets you publish it.
Your Next Step
Today, pick your theme and download one dataset from an official portal. Then write the question for Project 1 in a single sentence. If you’re still deciding whether data analysis fits you, start with our guide on how to become a data analyst with no experience.

Luiz Loiola is a digital strategist and the founder of PBX Daily. He writes about technology, programming, artificial intelligence, freelancing, remote work, career change, and online income, helping beginners and professionals build practical digital skills, create new career opportunities, and compete in the global online market.