
You work in the office of a delivery company. Every Monday your manager asks why last week was slow, and you’re the one who opens the spreadsheet, filters the late orders and finds the answer. Nobody calls it analysis, but it is. Lately you’ve started to wonder if that part of your job could become the whole job.
Becoming a data analyst with no experience is realistic if you learn a short list of skills in the right order and prove them with real projects. This guide covers what the job involves, why your old job helps, six steps in order, the job titles to search for, certificates and degrees, and when to learn Python.
What a Data Analyst Actually Does
A data analyst turns raw data into answers that help people make decisions. On a typical day, an analyst might:
- Pull data from a database, a spreadsheet or a company system.
- Clean it: remove duplicates, flag missing values and fix inconsistent names and dates.
- Summarize it with totals, averages and comparisons over time.
- Build charts and dashboards that a team checks every week.
- Explain what the numbers mean and what the team could do next.
The last point matters more than beginners expect: a correct number that nobody understands doesn’t help anyone.
Why Career Changers Have an Edge
Data only makes sense with context. Someone from healthcare knows why clinic waiting times jump on Mondays. Someone from sales knows when a big order is really one customer splitting purchases. Someone from logistics knows which delays come from the warehouse and which from the carrier.
Tools can be learned in months. Knowing how a business really works takes years, and you already have that in at least one area. Our comparison of entry-level tech jobs for career changers shows how data analysis compares with QA, IT support and web development. Worried about your age? Read whether it’s too late to switch to tech.



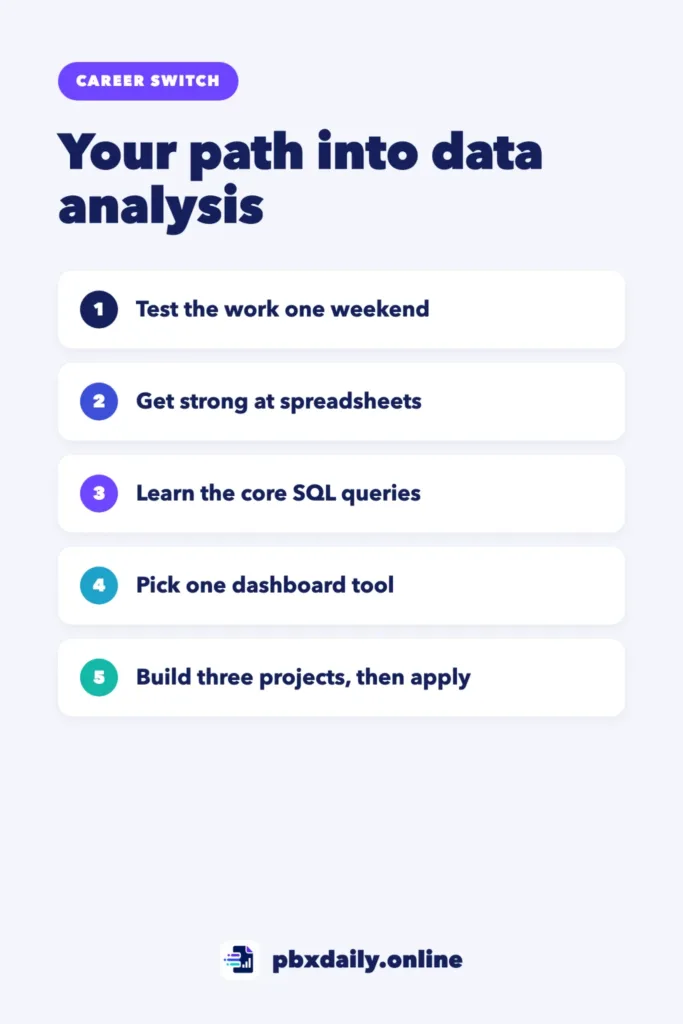
Step 1: Test the Work in One Weekend
Before you pay for any course, try a small version of the real work. Download a public dataset from your city’s or country’s open data portal, ideally on a topic close to your current job, and answer three questions about it in a spreadsheet.
If you enjoyed cleaning the data and finding the answers, that’s a good sign. If it felt like a chore, test another role before you commit months of study. Our guide on how to switch to tech with no experience has the same weekend test for other entry-level roles.
Step 2: Get Strong at Spreadsheets
A lot of analyst work still starts or ends in a spreadsheet. Learn these in Excel or Google Sheets:
- Sorting and filters: to find the rows that matter quickly.
- Pivot tables: to get totals and averages by group, such as sales by month.
- Lookups: VLOOKUP and the newer XLOOKUP, to bring information from one table into another.
- Charts: a column chart to compare groups and a line chart to show change over time.
Here’s a lookup you’ll use often. It finds the product code from cell A2 in column A of a sheet called Products and returns the matching value from column C, or “Not found” if the code isn’t there:
=XLOOKUP(A2, Products!A:A, Products!C:C, "Not found")The older VLOOKUP, still common in company files, does the same with a column number: =VLOOKUP(A2, Products!A:C, 3, FALSE). FALSE means “exact match only”.
Step 3: Learn the Core SQL Queries
SQL is the language analysts use to ask questions of a database. When the data is too big for a spreadsheet, or lives in a company system, SQL is how you get it out. A small set of queries covers a large share of what a junior analyst is asked: choosing columns, filtering rows, sorting, adding up by group and joining two tables.
Our guide to SQL queries for beginners teaches the eight you’ll use most, with one small sales table and the result of every query.
Step 4: Learn One Dashboard Tool
A dashboard puts the key numbers and charts on one screen. You only need one tool to start:
- Tableau Public: a free platform. Its FAQ is clear that workbooks and data you publish there are not private and anyone on the internet can see them, so use only public data.
- Power BI Desktop: Microsoft says you can create reports with it for free. Sharing reports inside a company requires a paid plan.
- Data Studio: Google’s tool, previously called Looker Studio. Google describes it as a no-cost tool, and it connects easily to Google Sheets.
To choose, read ten junior analyst listings in your area and count which tool appears most. Learn that one well. Filters, clear chart choices and a simple layout carry over if you switch later.
Step 5: Build Three Projects That Prove the Job
Courses show that you studied; projects show that you can do the work. Three are enough to start, as long as each one proves a different part of the job:
- A SQL analysis that answers one clear business question.
- A data cleaning project that shows the messy data before and the clean data after.
- A dashboard with a short written recommendation.
Pick one theme from the industry you know and use public data for all three. Never use real data from your current job, such as customer, patient or student records, even with the names removed. Our guide to building a data analyst portfolio covers the steps for each project, a findings page template and where to publish.
Step 6: Apply Smart: Hybrid Titles and Internal Moves
Many jobs involve analyst work without “Data Analyst” in the title. Search for these too:
- Junior Data Analyst
- Reporting Analyst
- Operations Analyst
- Junior Business Analyst
- Sales, Marketing or Supply Chain Analyst
Read the description, not just the title. If it mentions SQL, reports or dashboards, it’s analyst work. Roles that mix your old field with data, such as healthcare data analyst, turn your background into experience.
Also look inside your current company. Offer to build a weekly report or a simple dashboard for your team, then ask whether the reporting or analytics team ever hires internally. When you apply, rewrite your past work in analyst language with our career change resume guide, and prepare for “Walk me through a project you did” with our list of career change interview questions for tech.
Do You Need a Certificate or a Degree?
Neither is required by every employer. A well-known entry-level option is the Google Data Analytics Certificate. According to Google, no experience or degree is required, and it takes around 240 hours in total: about three months at 20 hours a week, or six months at 10 hours a week. It’s self-paced and offered through a monthly Coursera subscription with a free trial; check the current price for your country on the page. It covers spreadsheets, SQL and Tableau, plus an introduction to programming. It gives your study a structure, but it doesn’t replace the three projects.
About degrees, one honest note: the U.S. Bureau of Labor Statistics doesn’t track data analyst as a separate occupation. The closest one it covers, data scientists, typically needs at least a bachelor’s degree, and some employers prefer a master’s. Without a related degree, your portfolio has to do more of the work.
Python: Now or Later?
For most beginners, later. Spreadsheets and SQL let you answer real questions sooner. Python helps once you want to automate a cleaning task you repeat every week or handle files too large for a spreadsheet.
If you’ve already started Python, keep going. Just add SQL soon, and look at junior listings near you: count how many ask for SQL and how many ask for Python.
Data Analyst With No Experience: Frequently Asked Questions
Can I become a data analyst without a degree?
Some employers care more about skills than degrees, especially for junior and reporting roles, while others list a degree as a requirement. Strong projects, a clear résumé and knowledge of an industry make your application competitive without one.
How long does it take to become a data analyst with no experience?
It depends on your available time and your local job market. Learning spreadsheets, basic SQL and one dashboard tool, then building three projects, usually takes several months of steady study, followed by an active job search.
Is data analysis being replaced by AI?
AI tools are changing how analysts work, for example by helping write formulas or SQL queries. Someone still has to ask the right question, check whether the result makes sense and explain it to the team. Use AI as a helper, but understand every query it writes before you trust it.
Sources
- Google: Google Data Analytics Certificate
- U.S. Bureau of Labor Statistics: Occupational Outlook Handbook, Data Scientists
- Tableau: Tableau Public FAQ
- Microsoft: Power BI Desktop
- Google Cloud: Data Studio documentation
Your Next Step
This weekend, open your city’s or country’s open data portal, download one dataset about the industry you know and answer three questions about it with a pivot table and one chart. If you enjoy it, move on to our guide to SQL queries for beginners and start Step 3.

Luiz Loiola is a digital strategist and the founder of PBX Daily. He writes about technology, programming, artificial intelligence, freelancing, remote work, career change, and online income, helping beginners and professionals build practical digital skills, create new career opportunities, and compete in the global online market.