
You spent the whole afternoon on one bug. You changed a line, refreshed the page, changed another line and refreshed again. Then it worked, and you had no idea why. Debugging for beginners often looks like this: random changes and a lot of hope.
There’s a better way. This guide to debugging for beginners gives you a simple six-step method, a worked JavaScript example, a quick tour of browser DevTools and a table of the errors you’ll see most often.
What Debugging Actually Is
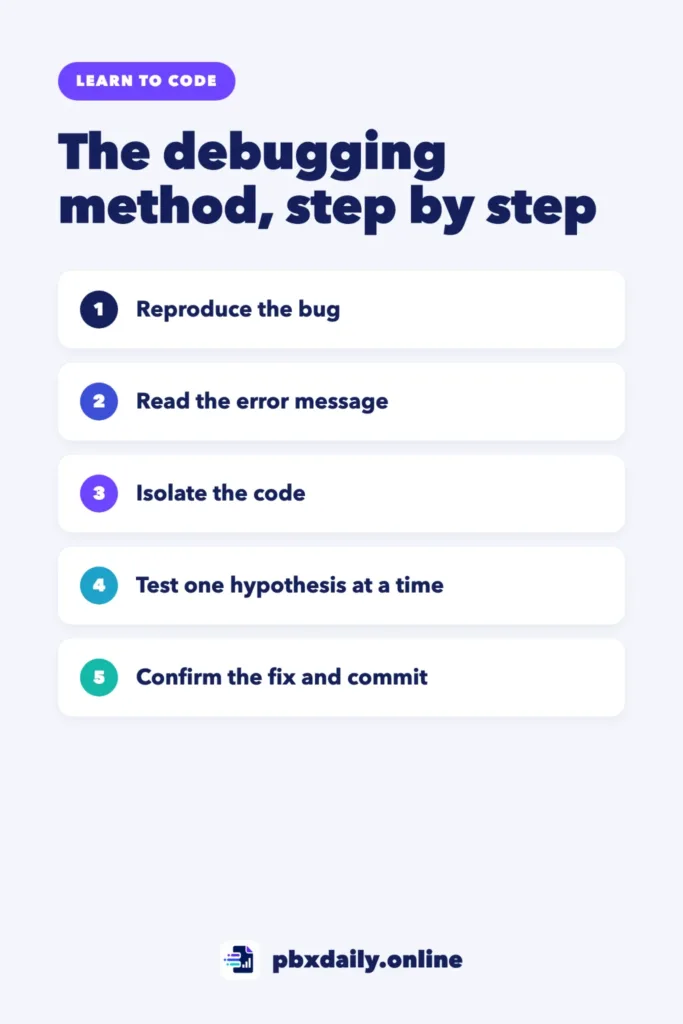
Debugging is the process of finding out why your code does something different from what you expected, then fixing the cause. It isn’t a talent; it’s a method you repeat: reproduce the problem, collect clues, test one idea at a time and confirm the fix.
The goal isn’t to make the error disappear. The goal is to understand it. A fix you can’t explain usually comes back later.
The 6-Step Debugging Method
1. Reproduce the Bug
Before you change anything, make the bug happen on purpose. Write down the exact steps: what you clicked, what you typed and what you saw. If you can’t make it happen again, you can’t know when it’s fixed.
2. Read the Error Message
Open the browser console and read the whole message, not just the first word. It usually tells you three things: the type of error, a short description and the file and line number where it happened. Click the file name to jump to that line.



Error messages look scary, but they’re clues. MDN’s JavaScript error reference explains each one in plain language.
3. Isolate the Problem
Find the smallest piece of code where the bug still happens. Comment out parts you don’t need, or check values at different points until you find where the data goes from right to wrong. A bug in 5 lines is much easier to see than a bug somewhere in 200.
4. Form One Hypothesis
Say your guess in one sentence: “I think total is empty because the function runs before the data loads.” One clear guess is better than five vague ones, because you can test it.
5. Test It
Check your guess with evidence. The quickest way is console.log() to print a value at a specific point. For more detail, set a breakpoint, which pauses your code on a line so you can inspect every variable. Change one thing at a time. If you change three things and the bug disappears, you won’t know which change fixed it.
6. Confirm the Fix and Commit
Repeat the steps from Step 1 and make sure the bug is gone. Then check that nothing else broke. Remove your extra console.log() lines and commit the fix with a clear message, like “Convert inputs to numbers before adding”. If you’re new to commits, our guide to Git and GitHub for beginners shows you how.
A Worked Example in JavaScript
Here’s a small page with two number fields and a button that should add them:
<input id="first" type="number">
<input id="second" type="number">
<button id="add">Add</button>
<p id="result"></p>
const button = document.getElementById("add");
button.addEventListener("click", function () {
const a = document.getElementById("first").value;
const b = document.getElementById("second").value;
document.getElementById("result").textContent = a + b;
});Reproduce: type 2 in the first field and 3 in the second, then click Add. The page shows 23 instead of 5. It happens every time.
Read the error: the console is empty. There’s no error, because the code runs. It just doesn’t do what you meant. These are often the harder bugs, so the next steps matter more.
Isolate: the result is built in one line, a + b. So either a and b are wrong, or the addition is.
Hypothesis: “23” looks like two pieces of text joined together. Maybe a and b are strings, not numbers.
Test: add one line before the result:
console.log(a, typeof a, b, typeof b);Click Add again. The console prints 2 string 3 string. The hypothesis is right: the value of an input is always a string, even when the input type is number. In JavaScript, "2" + "3" joins the strings into "23".
Fix: convert the values with Number() before adding:
const a = Number(document.getElementById("first").value);
const b = Number(document.getElementById("second").value);
Confirm: type 2 and 3 again. The page shows 5. Try 10 and 0.5 and you get 10.5. Remove the console.log() line and commit.
Using Browser DevTools
Every modern browser has developer tools. These examples use Chrome, but Firefox and Edge have similar panels. Open DevTools with F12, or right-click the page and choose Inspect.
Console
The Console shows errors, warnings and anything you print with console.log(). You can also type JavaScript directly into it to check a value, like document.getElementById("first"). If that returns null, the element doesn’t exist with that id. Google’s Console overview covers the basics.
Sources and Breakpoints
In the Sources panel, open your JavaScript file and click a line number. That sets a breakpoint. The next time the code reaches that line, it pauses. While it’s paused, hover over a variable to see its value, or look at the Scope section for all of them. Use the Step over button to run one line at a time and watch the values change.
Breakpoints are useful when you’d need many console.log() lines to follow what happens. See Pause your code with breakpoints for every breakpoint type.
Network
The Network panel lists every file and request the page loads. Open it and reload the page. If a script, image or API call failed, its row shows an error status, like 404 when the file wasn’t found. A wrong file path often looks like a JavaScript bug, but the Network panel shows the real cause. Learn more in Inspect network activity.
Common Beginner Bugs and What They Mean
| What you see | Likely cause | Where to look |
|---|---|---|
ReferenceError: x is not defined | A typo in a variable name, or the variable was created somewhere else | The spelling and the place where you declared it |
TypeError: Cannot read properties of null | Your code looked for an element that wasn’t found | The id in your HTML, and whether the script runs before the HTML loads |
TypeError: x is not a function | A misspelled method, or calling something that isn’t a function | The method name in the documentation |
SyntaxError | A missing bracket, parenthesis or quote | The line in the message and the line before it |
undefined where you expected a value | A function without return, or a wrong property name | Log the whole object and compare the names |
| Wrong result, no error | Strings instead of numbers, or the wrong variable | Log the values and their typeof |
| Nothing happens, no error | The script file didn’t load, or the event never fires | The Network panel and your event listener |
Debugging Checklist
- Can I reproduce the bug with exact steps?
- Did I read the whole error message, including the line number?
- Do I know the last point where the data was still correct?
- Can I say my hypothesis in one sentence?
- Am I changing only one thing at a time?
- Did I repeat the original steps after the fix?
- Did I remove my test logs and commit?
Still stuck after an honest try? Follow the routine in what to do when you get stuck while learning to code, including when and how to ask for help.
Debugging for Beginners: Frequently Asked Questions
What are the steps of debugging?
A simple method has six steps. Reproduce the bug, read the error message, isolate the code where it happens, form one hypothesis, test it with a log or a breakpoint and confirm the fix. Then commit. The order matters less than the habit of collecting evidence before you change code, so you always know why a fix works.
Is console.log debugging bad?
No. Printing values with console.log() is fast and works everywhere, and developers at every level use it. It gets slow when you need dozens of logs to follow a value through many steps. That’s when a breakpoint helps, because it pauses the code and shows every variable at once. Use both, and remove the logs after you fix the bug.
How do I debug when there’s no error message?
Start by writing down what you expected and what actually happened. Then print the values at key points, beginning where the data first comes in. Find the last point where the value is correct and the first point where it’s wrong. The bug lives between those two points. The worked example above shows this with a simple addition.
Does the same method work in Python?
Yes. Reproducing the bug, reading the error, isolating the code, testing one hypothesis and confirming the fix work in any language. Only the tools change: in Python you use print() instead of console.log(), and Python’s error output (the traceback) shows the line where things failed. If you’re still choosing a language, read Python vs JavaScript: which to learn first.
Sources
- Chrome for Developers: Console overview
- Chrome for Developers: Pause your code with breakpoints
- Chrome for Developers: Inspect network activity
- MDN Web Docs: JavaScript error reference
- MDN Web Docs: console: log() static method
Your Next Step
Copy the worked example into a file, open it in Chrome and set a breakpoint on the line with a + b. Watch the values while the code is paused, then apply the fix. If the basics still feel shaky, follow the right order to learn HTML, CSS and JavaScript and practice this method on every bug you meet.

Luiz Loiola is a digital strategist and the founder of PBX Daily. He writes about technology, programming, artificial intelligence, freelancing, remote work, career change, and online income, helping beginners and professionals build practical digital skills, create new career opportunities, and compete in the global online market.